Region Tracking
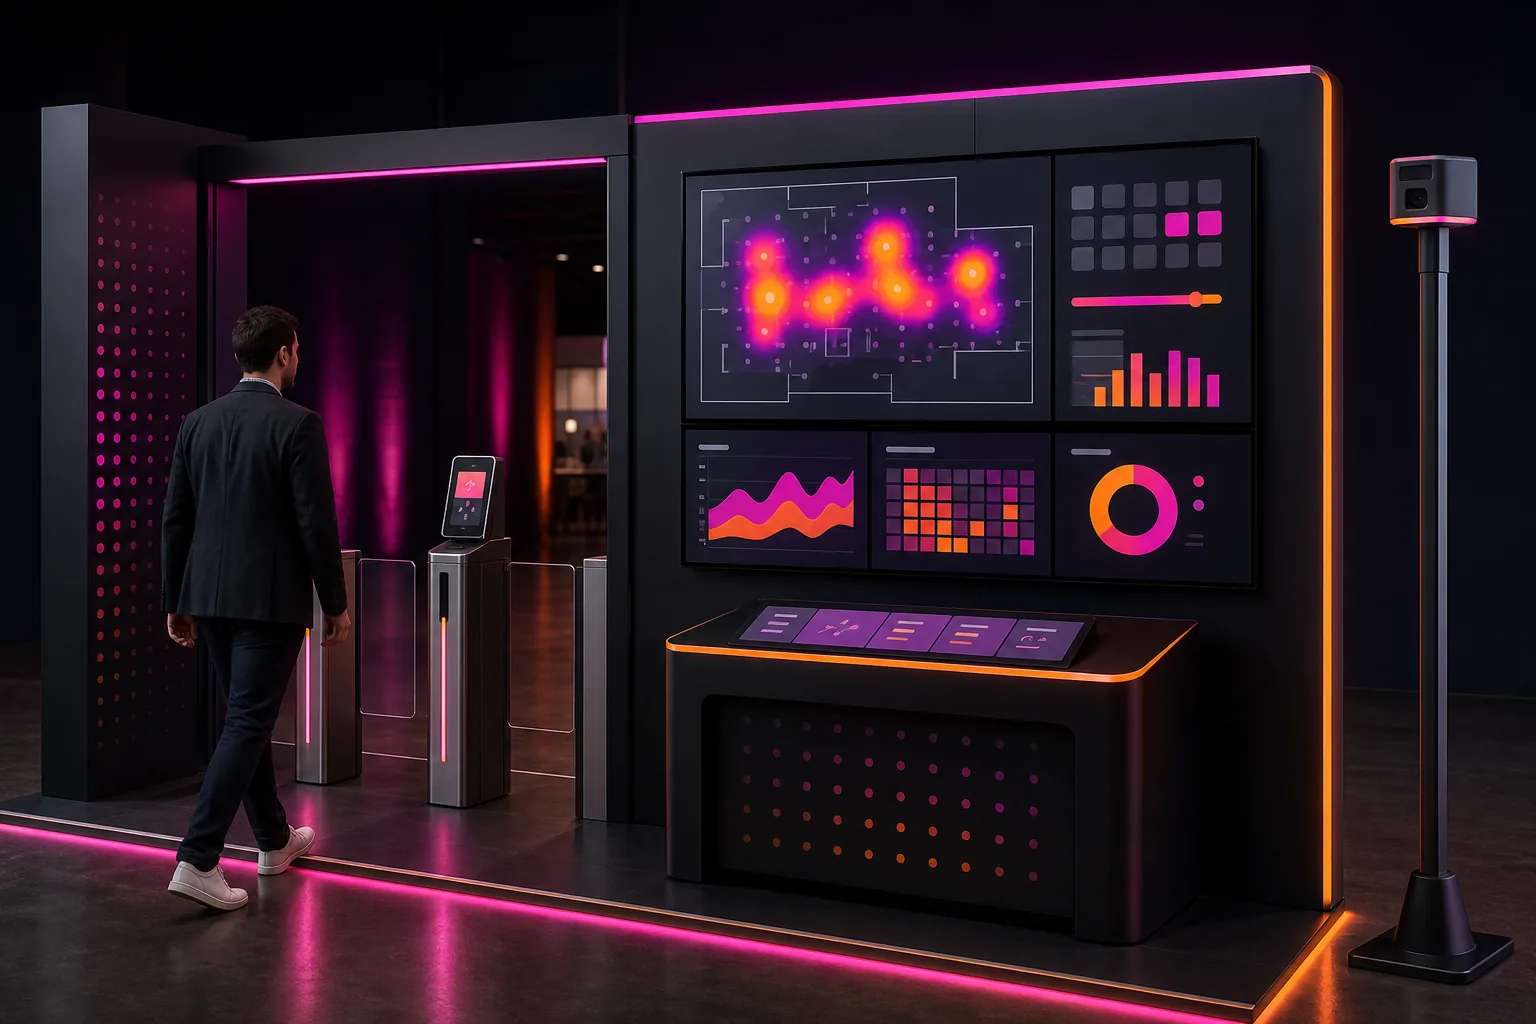
The area can be divided into separate measurement zones according to the operation need.
Understand the flow. Manage the field better.
Operations analytics solution, which is constructed to visualize anonymised intensity signals in defined areas in the event area over time and space.
These figures are preliminary planning ranges. Final capacity, space and installation plans are confirmed after a site survey.
Together, we configure the core features around your project goals, participant flow and available space.
The area can be divided into separate measurement zones according to the operation need.
The collected appropriate intensity signals are visualized by time intervals.
The regional movement of different hours or days can be compared in the report.
Events and touchpoints where this experience works best.
Customization options, from visual style to game flow.
The final technical plan is confirmed using the site survey and event details.
Core components of planning, production and delivery.
The right service option depends on duration, location, customization and operational scope.
Quick answers about use cases, customization and technical requirements.
Operations analytics solution, which is constructed to visualize anonymised intensity signals in defined areas in the event area over time and space.
Fair and festival areas; Museum and exhibitions; Retail experience areas.
Zone and time intervals; Sensor and data method; Panel and report indicators.
Stable network, electricity and at contact points QR/RFID reader placement; Data fields, access powers, retention time and export format are approved prior to the event; The detection method, the anonymization approach, the necessary permissions if there is camera use, and the data storage policy are approved.
Add the product to your quote list. We'll use your event details to define the scope, installation and service option together.